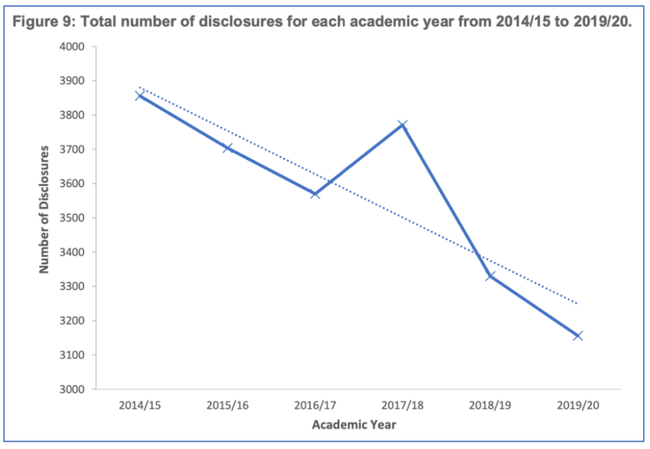
In November 2021, UKRI published a report showing that ‘Disclosures’ to Technology Transfer Offices at Universities in England had fallen by 18% over the five-year period from 2015 to 2020. All the other TT indicators (patenting licensing, income etc.) have gone up. In a Report where all the other graphs are going up, the one going down attracts attention.What’s going on?
This article looks at the data for Disclosures - as they are, and proportionate to research activity, to research staff numbers, and to patent applications; and provides observations about the data collection, the definitions used, and the increase in non-patentable Disclosures. [Warning - this is fairly techy stuff, lots of TT detail, charts, jargon etc.]
The variations in practice amongst TTOs and the questionnaire definitions in the data collection survey render much of the UKRI HEBCI HESA TT data far less useful than it could be, which is unfortunate, a missed opportunity, and a real concern if the data is to be used to determine the allocation of government funding to universities under HEIF and KEF. Opportunities to understand patterns on UK university Technology Transfer activity in the last twenty years have been lost due to poor data collection and variable approaches to reporting (understandable given the poor definition of questions). Maybe it is time for the sector to get more involved in the data collection and reporting as in the US, and elsewhere.
The UKRI Report is available here : ‘An Update on IP- Related and Commercialisation Activities in England in 2019/20. Report detailing IP-related and commercialisation activities submitted as part of the HE-BCI survey, focussing on those conducted in England in 2019/20.’ RE-P-2021-03 - November 2021.
The section on Disclosures on pages 12-13 shows the following graph, with the comments:
‘caution should be taken when discussing trends in disclosures as there may not be a consistent definition between providers as to what qualifies as a disclosure’ and ‘this decrease may be a result of greater selectivity around the definition of a disclosure rather than a decrease in discoveries or patentable ideas from providers.’
Disclosures
Caution indeed!
A Disclosure is defined as: “Disclosure is the point at which academic staff disclose their
idea through a formal process with the prospect of seeking protection.”
‘academic staff disclose’
In reality, the Disclosure is not when a researcher tells the TTO, it is when the TTO project manager enters something on the TTO database system (whatever form that takes), and we know that practice varies widely across universities and their TTOs.
‘formal process’
TTOs have different ‘house styles’ for registering something as a Disclosure, from - ‘well, we had a chat and it sounds interesting’ - to - ‘upon receipt of completed, signed Invention Disclosure Form’; and these house styles change over time, as management approaches change, possibly, sometimes relating to influencing the year-end figures for reporting purposes.
The actual number of disclosures is a balance between the volume of research, the number of researchers, the culture in an institution, the attitudes of individual researchers, the incentives involved, and the size of the TTO: researchers generate research results which they may or not choose to tell the TTO; the available TTO staff make a noise (aka ‘internal marketing’) which attracts attention, encouraging researchers to get in touch, and an entry on the database made.
‘prospect of seeking protection’
And what does ‘the prospect of seeking protection’ mean? Protection from what, from whom? We know this generally implies seeking protection in the form of Intellectual Property Rights, usually Patent protection. So if the Researcher tells the TTO about something really exciting but outside consideration for IP protection, or Patent protection, is it a Disclosure? Technology Transfer and Knowledge Transfer in the Arts, Humanities and Social Sciences is a boom area - are these Disclosures? Are they reported as Disclosures; sometimes yes, sometimes no, depending on TTO house style and interpretation.
The Data
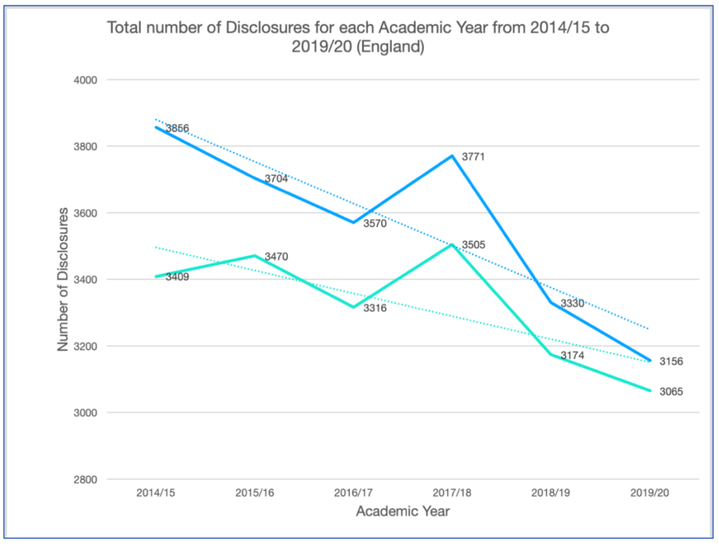
The data in Figure 9 from the Report above are for English universities only; the numbers are 3856 Disclosures in 2014/15 down to 3156 in 2019/20, a drop of 18%. The data for Manchester University stand out as they have declined from 447 to 91 Disclosures per year over the same period, a drop of 80% for Manchester. Removing Manchester from the aggregate English data gives an overall decline of 10%, rather different from the 18%. The big change for Manchester suggests a change in reporting approach rather than an unlikely change in the behaviour of Manchester researchers or its TTO. On the other hand, Cambridge has increased from 141 in 2014/15 to 311 in 2019/20, a 120% increase; remove their data and the decline would be greater of course. Does the Cambridge growth reflect house style in recording a Disclosure or an outbreak of TT enthusiasm at Cambridge?
The blue line is that shown in the UKRI Report; the green line is the same data with Manchester University removed, nearly halving the % decrease over the 5 year period.
The numbers of Disclosures at other universities stand out: Birmingham University is in the Top 6 for Disclosures in each of the last five years - a strong Research University, ranked about 12th for Research volume in recent years; and Coventry University is in the Top 10 for Disclosures in each of the last five years - not a leading Research university, ranked outside the largest 50 for Research volume.
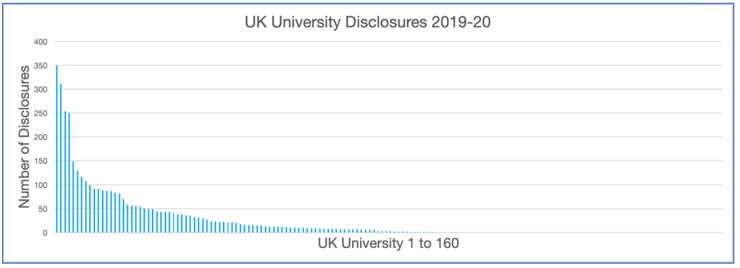
Overall, the number of Disclosures shows a typical ‘long-tail’ as follows.
Of the total number of universities, between 50 and 60 report more than 10 Disclosures a year, about 30 report up to 10 Disclosures a year, and about 70 report zero Disclosures. The Russell Group Research Universities account for the vast majority of Disclosures, averaging 65% per year for the last five years.
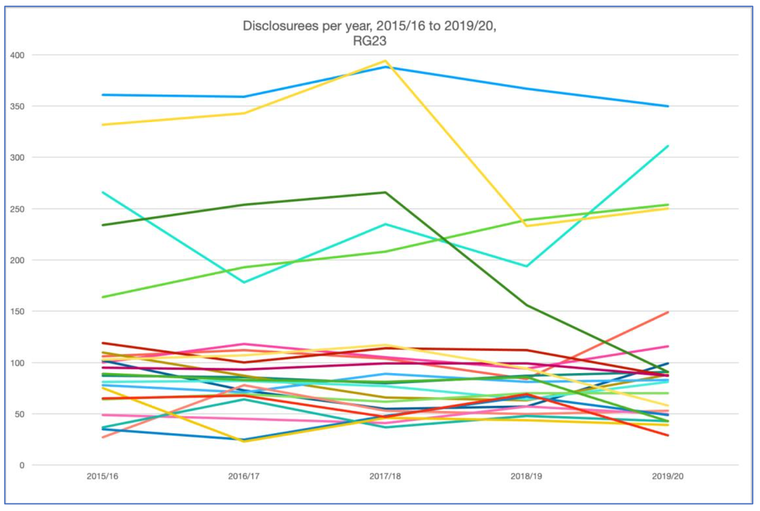
The remainder of this article focusses on the activities of the Russell Group universities, of which there are 24; one of the these, LSE, has reported zero Disclosures in the last few years and is not included; leaving 23 universities, the “RG23” in this article.
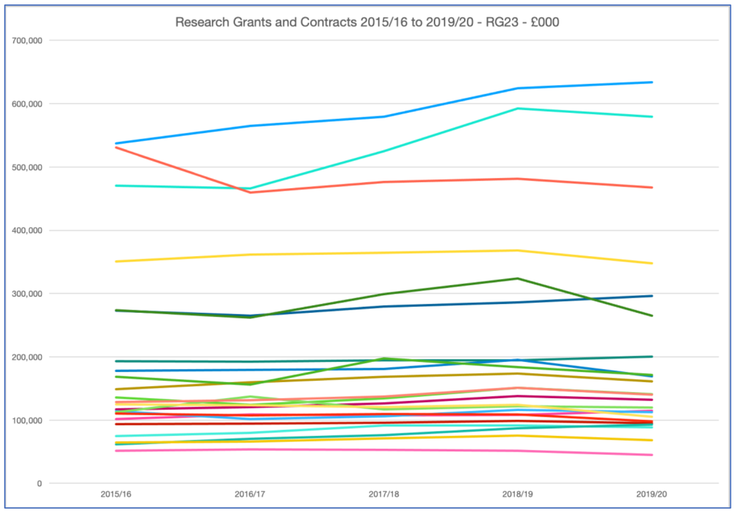
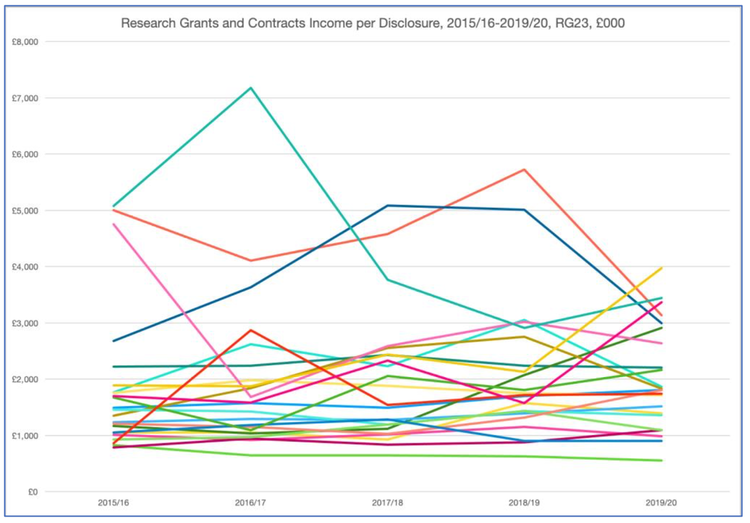
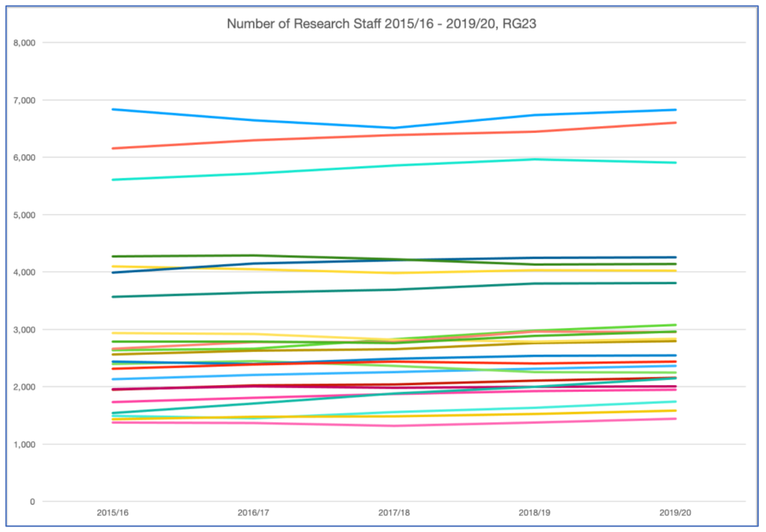
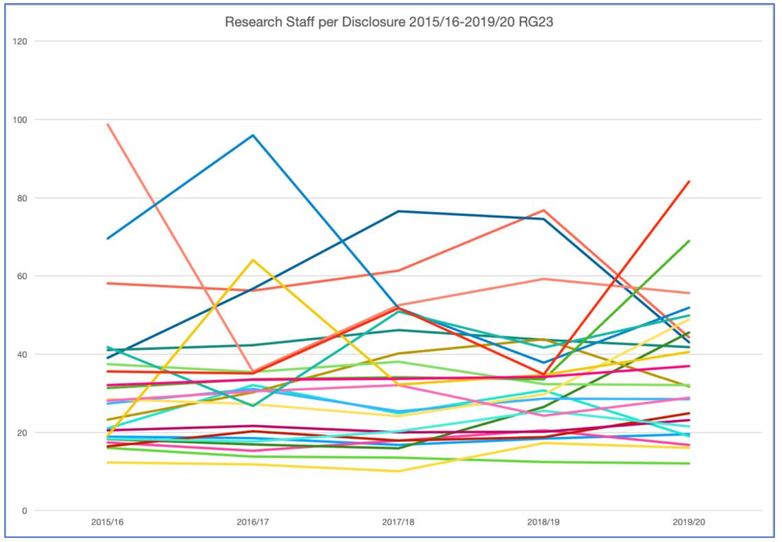
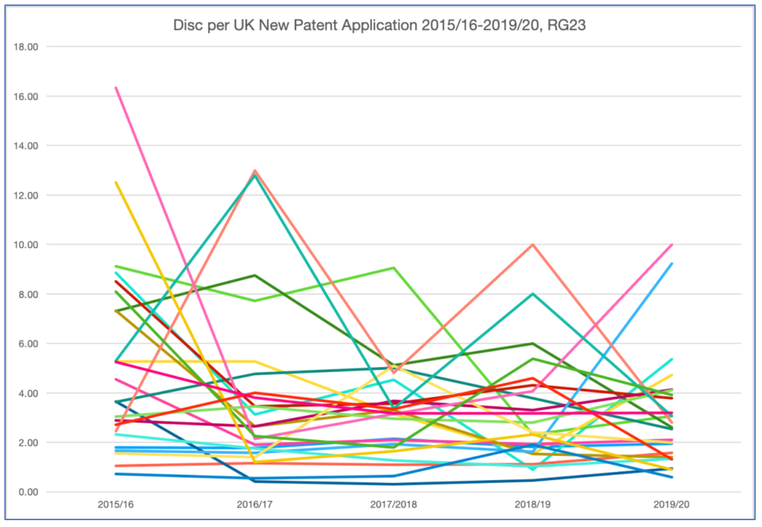
Each coloured line in the Charts is for one university, over the years. The Charts do not show the Legends (which line is for which university) as these distract from the patterns, and it is the patterns that are important. (Please get in touch if you would like to know which lines are which.)
The following sections go on to look at Disclosures by Research volume, Staff numbers, Patent applications, and the some concluding observations. sections
Disclosures and Research
We expect a positive link between the volume of Research at a university and the number of Disclosures.
The first Chart shows the volumes of Research at the RG23 (measured by Research Gants ad Contracts Income). In general, rising modestly with a few showing some modest decline.
The second Chart (below) shows the amount of Research that it takes to generate a Disclosure; Research volume per Disclosure. Given the erratic nature of some of the Disclosure Data it is not surprising to see some of this data looks ‘all over the place’.
In 2019/20, the average Research per Disclosure for the RG23 is £2M ranging from £0.5M to £3.5M. Over the last five years, the average Research per Disclosure for the RG23 is £1.8M ranging from £0.6M to £4.3M. The old idea of a disclosure for each million of research seem well out of date.
There is then the question of the volumes of Research that may be unsuited to ‘seeking protection’ - should these be taken out somehow?
Disclosure and Research Staff Numbers
We should expect a positive link between the number of Research Staff at a university and the number of Disclosures. After all, it is people that tell the TTO about research results, not money.
The first Chart shows the number of Research Staff at the RG23 (measured by ‘Research only’ and ‘Both teaching and research’ categories) . In general, fairly steady over the last five years.
The second Chart (below) shows the number of Research Staff it takes to generate a Disclosure; Research Staff per Disclosure. Given the erratic nature of some of the Disclosure Data it is not surprising to see some of this data also looks ‘all over the place’.
In 2019/20, the average Research Staff per Disclosure for the RG23 is 37 ranging from 12 to 84. Over the last five years, the average Research Staff per Disclosure for the RG23 is 32, ranging from 13 to 54.
There is not an ‘old idea’ of the number of Research Staff per Disclosure as this has not been considered before; it’s an interesting one. And then there is the Research Staff whose research may be unsuited to ‘seeking protection’ - should these be taken out?
Disclosures and Patent Applications
There should be a very useful link between the number of Disclosures and the number of Patent Applications that are filed by the TTO. But there isn’t, not from the UKRI HESA HEBCI data anyway.
The definitions certainly let us down again; as do the varying reporting approaches, and the added complications about Disclosures being things that are defined as ‘seeking protection’, but may not all be suited for formal IPR protection.
Definitions
“Number of new patent applications filed in year includes all Patent Co-operation Treaty (PCT) applications.... The number of new patent applications filed in year ... are sub-totalled in subtotal overseas to allow the calculation of UK and total international filings.”
Trying to match these definitions to the way things usually work is impossible. The ways things usually work is: (1) the TTO files a priority UK patent application; (2) a year later a PCT application is filed on some; and (3) for a selection of these, a range of regional and international applications are filed a couple of years later on.
So ... I file a UK priority patent application and a year later a PCT.
- Does this count as 1 for this year and also 1 for next year?
- Is the PCT application ‘overseas’ or not? WIPO are based in Geneva, but you send the PCT to a receiving Office (in the UK) who send it on to WIPO and international Authorities for searching and examination (the EPO in Germany and Belgium).
Why don’t they ask for the number of Priority patent applications filed? A point made many times over the years. Here’s a thought: Should this data collection be taken back into the TT profession (PraxisAuril maybe), and for the profession to take responsibility for generating useful data? Yes, it is complicated, but the leading TTO’s and ‘the sector’ ought to be able to work this out.
Reporting
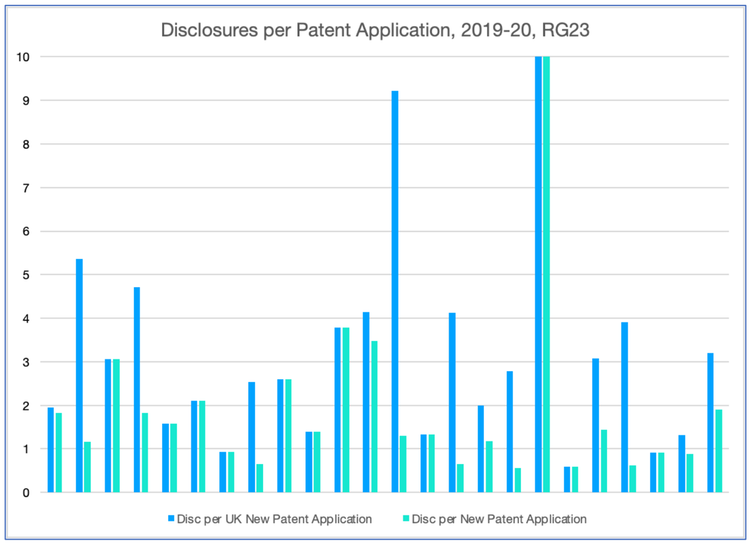
Many of the RG23 (11 out of 23 in 2019/20) routinely report zero ‘subtotal overseas’ patent applications, which is a reporting decision, and does not reflect what they are actually doing.
Chart
The bar Chart (below) shows data for the most recent year only and shows the huge variation.
The average is 3 Disclosures per new UK patent application, and 2 Disclosures per patent application (including overseas). The variation is wide, from 10 to less than one. ‘Less than one’ is interesting, especially for UK applications - more than one new UK patent application for each Disclosure is unusual; although of course there is a time lag from Disclosure to patent application, so theoretically possible for a year, unlikely over time.
The basic data on how many Disclosures lead to a patent application, how many patent applications are likely to be filed based on an expected number of disclosures are simply not available in any reliable form.
The final Chart (below) shows Disclosures per Patent Application for the RG23 universities; the data is unreliable, although a few universities do show consistent patterns (lost in the kaleidoscope of the chart).
At the level of a single university TTO, with stable data collection and reporting methodologies, comparisons can still be made from year to year, and patterns established. Between universities, the data is close to useless.
Observations
The UKRI data shows that Disclosures have fallen by 18% over the last five years.
The data collection questions are vague and open to wide interpretation. The approach to data reporting appears to vary significantly between universities. The data is unreliable.
This matters because:
- We can’t use data to analyse TT practice and activities in the UK. The HEBCI Survey has been going for 20 years; a missed opportunity.
- We should be interested in the flow through from volumes of research income, numbers of research staff, through to Disclosures to the TTO, the TTO patents activity (not least as it costs a lot of money), through to Deals and Income. With better data, we could for example try to detect the emergence of more TT/KT activity from the Arts and Social Sciences.
- The data for Research Income and Research Staff are accurate; universities are on top of this. The data for Disclosures reflect hugely varied practice in UK universities; the data for patent reporting are hugely varied. The data for Deals and Income are not addressed here; my guess is the data for Income is accurate these days.
- The UKRI HESA HEBCI data in these areas may be used to allocate funding in future with HEIF and KEF and it is not fit for purpose.
Serious consideration should be given by the UK TT community - universities, TTOs, professional associations, government agencies - about how to fix this.
As every journal paper seems to say (and this isn’t one), there’s more work to be done - for sure!
Those of you have read this far may be wondering what on earth was he doing over Christmas .....? Well, I never could resist a good spreadsheet.
Here’s another question: Why are they called Disclosures?
If anyone is sufficiently interested to want to follow up on the data and the approach, please do get in touch - [email protected]
Sources:
UKRI UK Research & Innovation www.ukri.org
HESA Higher Education Statistics Agency www.hesa.ac.uk
HEBCI HigherEducationBusinessandCommunityInteractionsurvey
www.hesa.ac.uk/data-and-analysis/business-community
www.hesa.ac.uk/data-and-analysis/business-community/ip-and-startups
www.hesa.ac.uk/data-and-analysis/finances/income www.hesa.ac.uk/data-and-analysis/staff/table-7

